Linux bandwidth monitoring and network accounting tools
 Some time ago I was looking for tools to monitor network bandwidth usage by clients. Needed something to run on my super awesome Linux router/firewall (Vyatta) to see what everyone on the network is doing and on the Xen VM hosts to keep an eye on the virtual machines.
As always with Linux, there are lots of quality projects worth serious consideration, so the hardest part was to narrow the plethora of choices down to a manageable number to test.
Specific requirements were:
- Runs on Linux
- Keeps historical data
- Not a resource hog (RAM, CPU or Disk)
- Keeps data in a format easily queried by other tools
- Released under an Open Source license
Out of the various tools I've tried, Netacct-mysql is currently my favorite. It collects bandwidth data through libpcap and stores in a MySQL database (reportedly, PostgreSQL and Oracle are also supported). It comes with a dedicated PHP front end, but to me the real power is that it stores the stats in the database, so through SQL SELECT statements, I'm able to get all the stats I need.
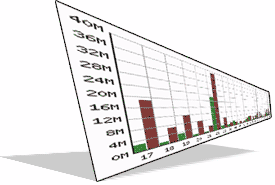
I was thinking about taking it a step further and getting some pretty graphs out of the data. Matt Dunlap, had suggested taking a look at PHP/SWF Charts.. Looks promising and it's on my to do list.
Meanwhile, here are the installation steps for Netacct-mysql on Vyatta. Steps apply to Debian as well, since Vyatta is based on Debian (if you believe /etc/debian_version, which, on both Vyatta VC2 and VC3, reports "Debian 4.0", aka "Etch"):
apt-get install mysql-server libpcap-dev gcc libmysqlclient15-dev make
wget http://netacct-mysql.gabrovo.com/download/netacct-mysql-0.78.tar.gz
tar xvfz netacct-mysql-0.78.tar.gz
cd netacct-mysql-0.78
mysql -uroot -p < netacct.sql
mysqladmin -u root password yourpasshere
mysql -u root -p yourpasshere
GRANT ALL PRIVILEGES ON netacct.* TO 'acct'@'localhost' IDENTIFIED BY 'somepass';
FLUSH PRIVILEGES;
quit
cd ~/netacct-mysql-0.78
./configure
make
make install
Edit nacct config files and define your options (e.g. enter the MySQL pass for user acct, define your network adapters and your networks)
vim /usr/local/etc/naccttab
vim /usr/local/etc/nacctpeering
cp contrib/nacctd.debian /etc/init.d/nacctd
update-rc.d nacctd defaults
/etc/init.d/nacctd start
ps aux | grep nacctd | grep -v grep
All done. Give the nacctd daemon about an hour (it keeps hourly stats) and you should start seeing numbers in your DB. Let's see some stats!
mysql -u root -p
use netacct;
SELECT * FROM traffic;

# Get total (in+out, in GBs) bandwidth used by 10.2.28.122 during Dec 07
SELECT SUM((input+output)/1073741824) FROM traffic WHERE IP='10.2.28.122' AND time LIKE '2007-12%';

# Get (in & out, in GBs) bandwidth used by all hosts during Dec 07
SELECT traffic.ip, sum(input)/1073741824 inp, sum(output)/1073741824 outp FROM traffic WHERE time like '2007-12%' GROUP BY ip;
Hope you're getting nice stats and that warm fuzzy feeling which comes with a false sense of security. For some additional info, check out the Netacct-mysql project page. Also, take a look at this post on Monitoring Bandwidth Usage for a Xen node, which is where I first learned about Netacct-mysql.
In addition to Netacct-mysql, I frequently use a couple of other tools also. Check them out!
- Bmon
 I use this one for real time bandwidth monitoring at the console. Bmon tracks usage by interface. Looks great for a console tool. Description of the tool from the project page: "bmon is a portable bandwidth monitor and rate estimator running on various operating systems. It supports various input methods for different architectures. Various output modes exist including an interactive curses interface, lightweight HTML output but also formatable ASCII output."
 - Vnstat
 Provides a historical view of bandwidth usage. Also tracks usage by interface. I use this one when I want a general overview of bandwidth usage, particularly on the edge router to see how close I am to overage charges from my colocation provider. The tool comes with a number of pre-configured display options (e.g. hours, days, weeks, months, top10). Can also measure and report back usage for a specified period time (e.g. 60 seconds). Description of the tool from the project page: "vnStat is a network traffic monitor for Linux that keeps a log of daily network traffic for the selected interface(s). vnStat isn't a packet sniffer. The traffic information is analyzed from the /proc filesystem. That way vnStat can be used even without root permissions. However, at least a 2.2 series kernel is required."
Well, that's it. If you have some pointers, please leave a comment! Happy Festivus to all!
2 Comments
1. David Esquivel replies at 29th July 2012, 5:12 pm :
Do you know if this product is still in use? I tried to install on a CentOS 6 box and the configure fails on the MySQL check. All the Devel libs are installed but it does not seem to recognise the format of the mysql.h file. I suspect that the newer version of MySQL is not supported.
2. Alain Kelder replies at 30th July 2012, 7:08 pm :
Not sure, haven’t used it in a while, though it looks like it hasn’t been updated in a few years. Here are a few others that sound interesting:
Leave a comment